In this article, we will share a quick and easy guide to sap debugging for functional consultants. When it comes to ABAP code debugging or analyzing an ABAP program, functional consultants frequently struggle. This is to help those who would like to explore and learn the SAP ABAP Debugging knowledge area. This is helpful for all functional people with minimal knowledge of SAP.
Table of Contents
What is debugging?
Definition: Debugging is the way to find the root cause of SAP transaction behavior (e.g, finding a reason why a certain value in a field was updated or determining why users receive an error, warning, or abnormal transaction termination message during transaction processing).
Why do we need to Debug?
- Debugging is necessary if the root cause cannot be determined from functional methods such as checking to customize or master data.
- Because ABAP is SAP’s backbone, every member of a functional team must have dealt with SAP development technicalities underlying business functionality at some point. This need for technical details can occur during various phases, such as writing functional specifications or analyzing production environment issues.
- To understand basic terminology for ABAP and various tools and techniques for debugging.
- This knowledge is helpful when you are trying to find the root cause of an issue or designing a needed functionality to fill a GAP in requirements.
Introduction of sap debugging for functional consultants
SAP ABAP Debugging is a tool that helps to identify and analyze errors. Through debugging, we can analyze a program, understand the flow logic and most importantly find out the root cause of any issue. Debugging is a task that an ABAP consultant should be familiar with, although functional consultants would also benefit immensely from debugging skills. It will save their time for analysis and issue resolution, reduce the over-dependence of the ABAP team, and help in effort estimation.ABAP debugger is an integrated testing tool within the ABAP workbench through which we can check the flow logic of programs.
What is ABAP Debugging?
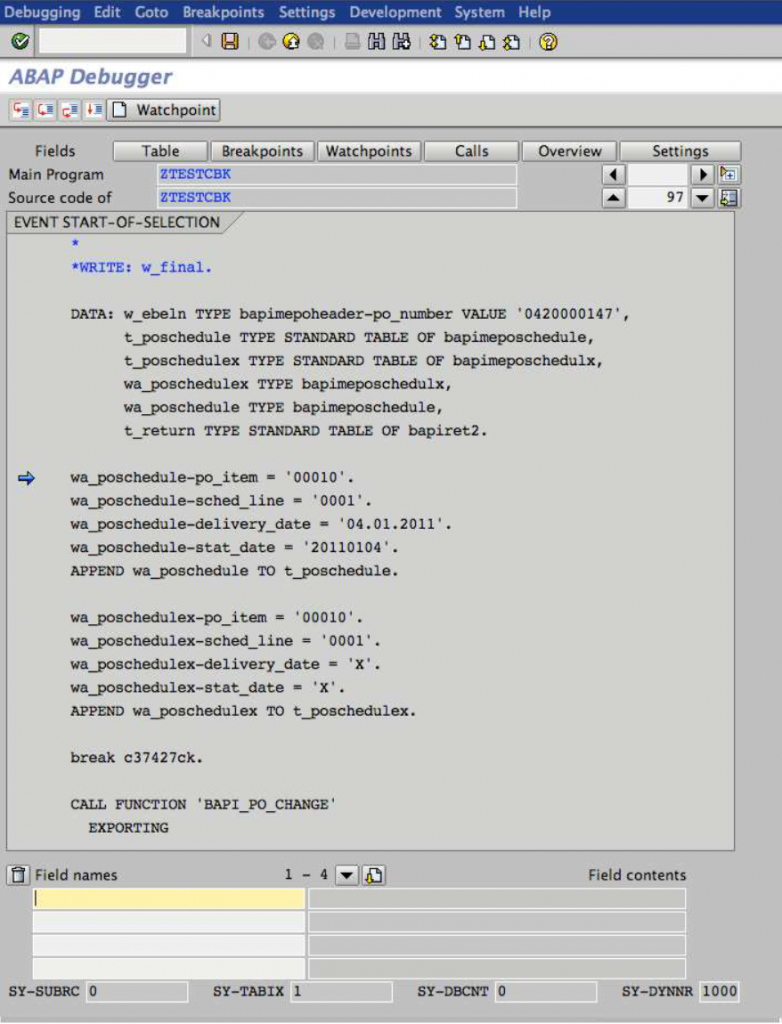
Debugging is when you stop a program or transaction at a certain point, so you can walk step by step through the ABAP programming to see where an error occurs. But as a functional consultant you need basic ABAP skills to be able to do this, Most good functional consultants will have basic debugging skills and this is very very important because it reduces the excessive independence of ABAP teams. Most of the time, part of our workload is to resolve errors that occur during the execution of certain transactions. However, if these errors message cannot be resolved by setting up the master data or transactional data (i.e.: error message without any meaning) you need to access the program in debug mode (by typing “/h” in the transaction bar and then executing the transaction), which will allow us to analyze the program and see where the problem lies, and thus save time.
If you are not sure about which line of code you want to debug, enter transaction /h in the command prompt, sometimes referred to as the OK CODE, while executing any transaction. Press Enter to activate the debugger. You’ll see the message in the status line and now if you were to press enter again, hit save, or perform any function on this transaction, you will see the DEBUGGER screen appear
Types of Debugger
Two types of debuggers
- Classic debugger
- New debugger
The Classic ABAP Debugger runs in the same role area as the application being analyzed. The Classic ABAP Debugger is a one-process debugger, where the debugger and debugged run in the same internal session.
The New debugger: The New debugger is a two-process debugger, available for all releases after 6.40. The new ABAP debugger starts in a separate external session.-> In the new debugger, the debuggee session will be inactive while the debugger is active. So during debugging we can still see the input values in the debuggee screen. As long as the debuggee session is active, the debugger is not shut down. The advantage is the debugger with all the settings, variables, and breakpoints is always available when we restart debugging. /hx command in a debug session ends the debugger session.
A debugger settings screen appears. Go to Settings->Options.

Selecting and switching the debugger
Debugger settings
If we choose “Close Debugger After Continue (F8) and Roll Area End”, the debugger will be closed after we execute the program. With this setting, the debugger behaves like a classic debugger.

Selecting the debugger
We can chose the debugger type in the ABAP development environment for example, in ABAP editor(Tcode – SE38) or in the object navigator(Tcode – SE80) via menu path Utility-> Settings

In the user-specific settings, select the classic debugger or new debugger option. The selected debugger option will become the default debugger tool for the user.

Switching the debugger
We can switch between the classic debugger and the new debugger at any time. From classical debugger to new debugger, through path Debugger -> switch to new ABAP debugger

Debugging Function Keys and their functionality
Starting the debugging session, The new debugger can be started with the same commands as a classic debugger.
- Using the command “/h”
- Execute the program in debug mode
- Setting breakpoint
Commonly used debug keys:
- F5 – Single-step execution
- F6 – Single step/skip subroutines
- F7 – move to the next breakpoint or finish loop
- F8 – Execute / Stop at the next breakpoint
New Debugger screen main parts Desktop
- Control Area
- Tool
- System fields
- Process Info
The new debugger has 3 custom desktops, 7 standard desktops
- Standard
- Structures
- Tables
- Objects
- Detail Display
- Data explorer
- Breakpoint/Watchpoint
In the new debugger, we can scroll vertically and horizontally through source code. New Debugger screen main parts

Customize the debugging desktop components
We can maintain up to 4 tools on the desktop. We can undo the layout changes by clicking on the back button. We can customize the desktop at our convenience using the following buttons on the right side of the debugger screen.
- Close the current tool
- Add new tool
- Replace current tool
- Make the current tool full screen and – to align/maximize tools vertically or horizontally
- Swap tools
- Services of the tool
We can save the current layout of the user-specific desktop using the layout save button of the new debugger. When the swap tool button is selected, the following pop-up screen appears. Based on the option selected, tools will be swapped. When we click on the “add new tool” or “replace tool” button, a pop-up screen appears to choose the new tool to be displayed or replaced on the desktop. Then the selected tool will get added or replaced on the desktop. on desktop.
Variable fast display
Variable fast display or variable overview displays data objects with current content and technical attributes. Variables 1 and 2: Double-click on any variable to get its content and attributes. Local and global tabs display all local and global variables of the current program. We can select the default tab in the variable fast display using the menu path Settings->Options. In new

In the new debugger options screen select the default tab for the fast variable display tool. We can filter out the global variable by selecting the checkbox to hide constants, tables, data, and common parts.

Break point
The breakpoint is the indication to the ABAP runtime processor to stop the program processing at a certain specified statement and to start the ABAP debugger.
Types of breakpoints
- Static breakpoint
- Dynamic breakpoint
Static breakpoint: Static breakpoint is useful during the development phase. We can set the breakpoint using the keyword BREAK-POINT. Due to this hard coding, the program is interrupted regardless of the user who executes it. BREAK user_name Using this command, the program is interrupted only when the specified user runs the program. We can find the static break point in the program using an extended program
check or transaction code SLIN. Chose Program -> Check -> Extended Program Check or TCode SLIN

Dynamic breakpoint
It is set in the ABAP editor or debugger by double-clicking on that line. These breakpoints are user-specific and will be deleted when the user logs off. We can delete or deactivate the breakpoint at runtime. On selecting create breakpoint from the menu options as shown below

Create Breakpoints A pop-up screen appears where we can choose the type of dynamic breakpoint as per requirement.

Breakpoint at statements The Debugger stops program immediately before a specified program statement is executed. Break point at subroutines The Debugger stops the program immediately before a specified subroutine is executed.
Breakpoint at function module
The debugger stops the program immediately before the specified function module is executed. Breakpoint at method The Debugger stops the program immediately before the specified method is executed. There is a separate tab for managing breakpoints in the new debugger. We can activate or deactivate or delete or create any breakpoint in the breakpoint tab of the debugger.
Double-clicking on the navigation button shows a breakpoint on the source code.

Watch point
Watch points are user-specific dynamic breakpoints. We can define watch points in the debugger screen to monitor the content of specified fields. We can set a watchpoint to interrupt program execution when the content of a field or structure is changed
- Local watchpoints are valid in a specific program
- Global watch points are valid in a specific program and all the programs it calls.
- Click on create watch point button on the debugger screen.

Select a local or global option as per the requirements. Mention the program for which we want to set watchpoint; the current program name will default in the program field. If we just enter the field name and select continue, the breakpoint will be created in such a way that every time the content of the field changes program execution will be interrupted.
We can create conditional watchpoints by selecting appropriate relational operators like >, <, >=, <=, <>, =. As soon as the watchpoint field values change or the condition is met, the debugger will stop and the system will show the message “ Watchpoint is reached.” We can set a watch point for internal tables in the new debugger. If we set the watchpoint at a table without mentioning the condition, the debugger will stop whenever the table content changes. This affects program performance and also creates memory problems. So it is preferred for short program durations. The new debugger creates a clone of the watchpoint variable. So once the watchpoint is reached, we can see the old and new values of a variable.
Internal table and related operations in debugging
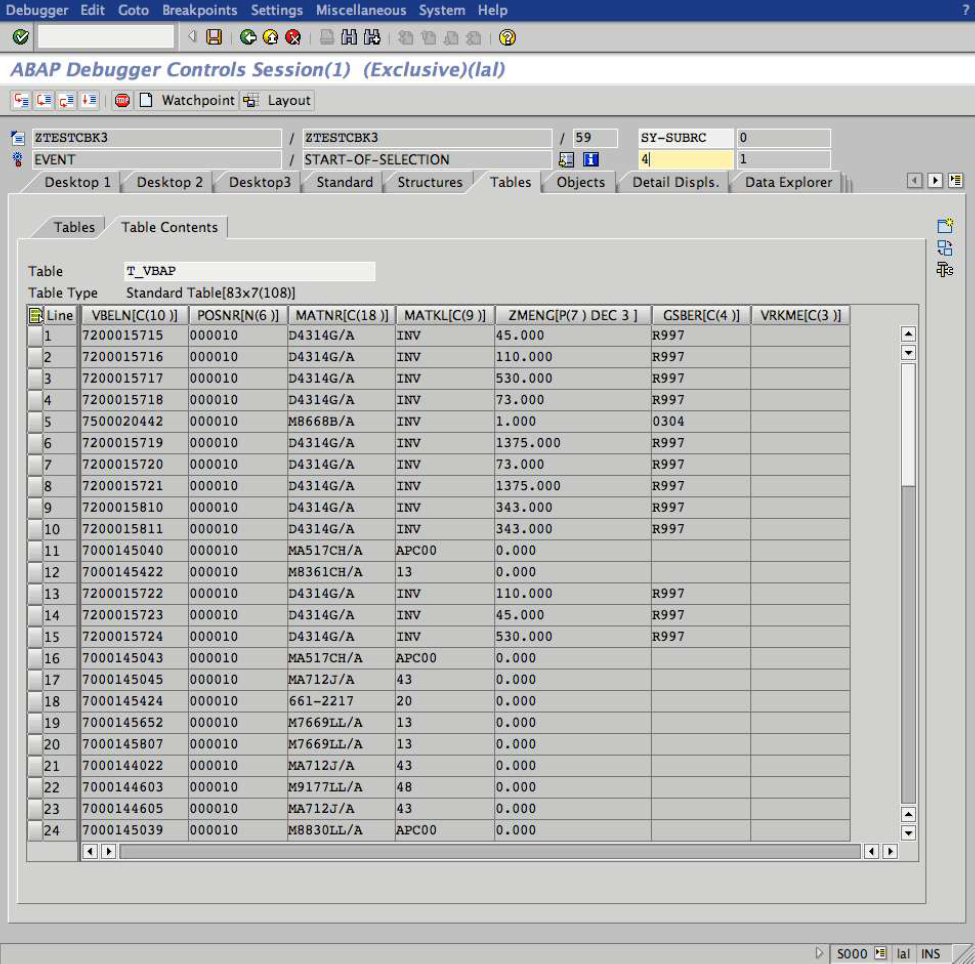
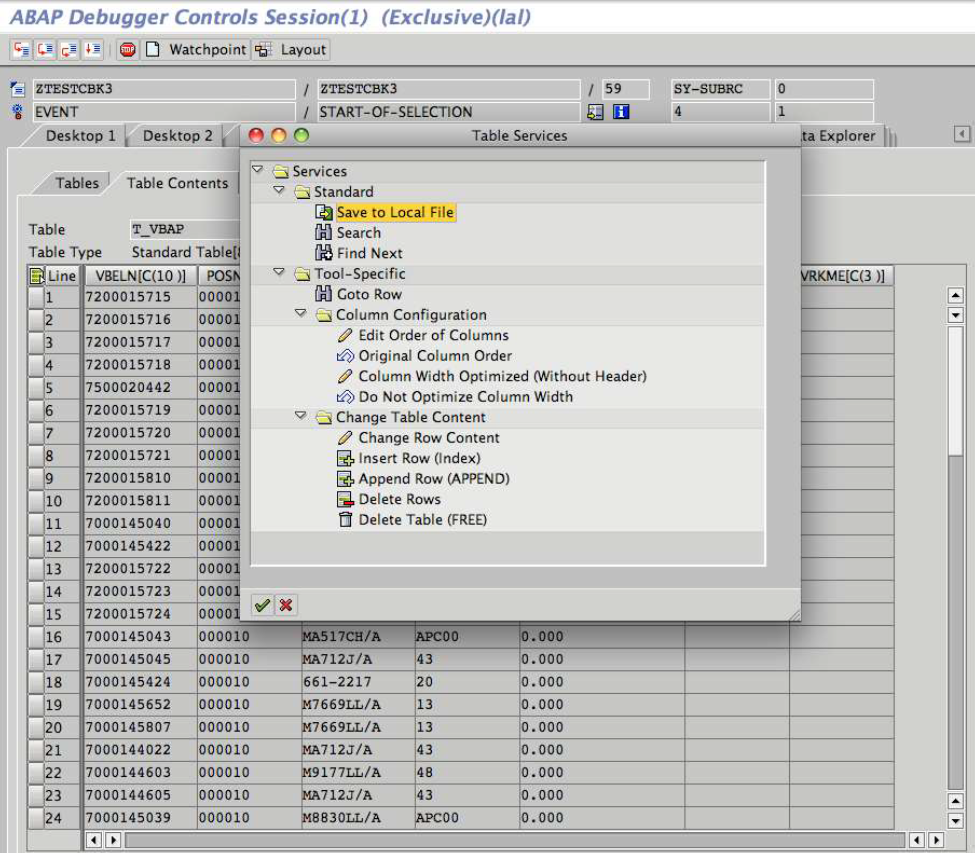
The internal table in the new debugger We can save internal table data to local files by clicking on the table services Button

Chose to save to local file and continue services button

Select the number of records and data format for the download file We can delete the entire internal table content or selected records by choosing delete table. On confirmation, the internal table will be completely refreshed. We can upload the data to the internal table in debug mode from a local file on the desktop.
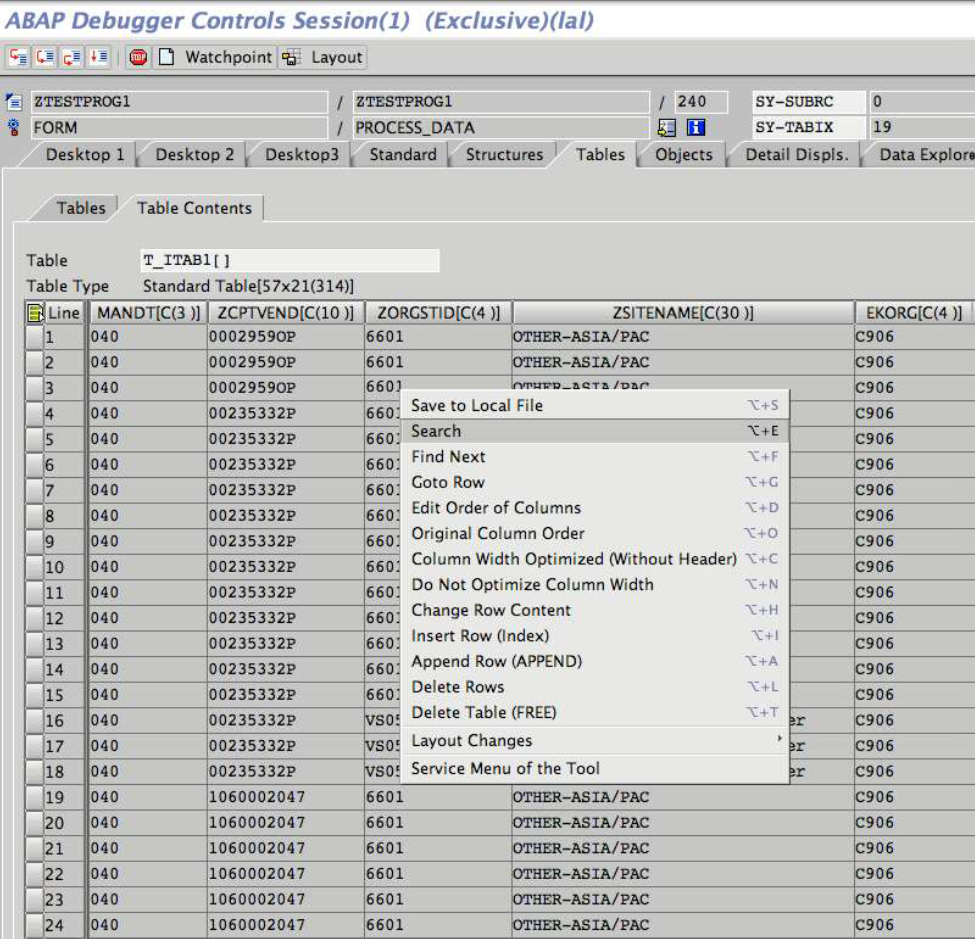
We can insert new records to the internal table using the context menu of the table. Right-clicking on the internal table record and choosing Insert Row from the available options A pop-up appears asking you to use a template while creating a new record. If we choose to use a template, a new record will be inserted at the selected position. In the new debugger, we can scroll through the internal table vertically or horizontally.
We can search for a specific field value in the internal table. For example, Go to the context menu of the internal table and choose “search.”

Conclusion
These are some fundamental facts that functional consultants may find beneficial. As we become more involved in debugging, we will be able to investigate many more aspects. Those abilities can only be acquired over time through real-world practice. I hope this was useful.
You might also like the below articles.
- SAP BRIM
- SAP ALM
- Cloud computing
- Advantages of sap
- Best ERP Software
- SAP Solution Manager 7.2
- SAP Technical
- SAP Solution manager
- SAP C4HANA
- SAP Successfactors
- MRP live
- SAP Best Practices
- Sap learning hub
Here are some interesting training videos you can watch on YouTube.
Tell me about the difference between watchpoints and breakpoints.
Breakpoints and watchpoints are essential tools in debugging, serving different purposes and ways. Breakpoints pause program execution at specific lines of code, allowing for step-by-step analysis and inspecting variables. They provide control over where and when the program should be paused, making it easier to analyze behavior. Watchpoints monitor the value of a variable or memory location, paused when the variable’s value changes. They can be set on variables suspected of causing issues and automatically pause the program when certain conditions are met. Both tools are crucial for troubleshooting and resolving program issues.